Welcome to a comprehensive guide on mastering the art of chart reading in technical analysis. Whether you’re a seasoned investor or just starting your journey into the world of stocks, this guide is a must-read for you because it contains the essential knowledge and skills needed to help you analyze charts effectively. We’ll delve into various chart types, key components of technical analysis charts, technical indicators, strategies, practical applications, and valuable resources to empower your investing decisions.
Introduction to Chart Reading in Technical Analysis
Technical analysis is the foundation of understanding charts in stock Investing. It is a step-by-step approach that looks at past price and volume data to study how a stock has moved over time. So, the main idea behind technical analysis is simple. It believes that past price behavior often helps predict future trends.
Now, when it comes to chart reading, it is at the very center of technical analysis. This is because it helps you spot patterns, trends, and possible price changes. As a result, it can give you useful insights when making investment choices.
And as you dig deeper into technical analysis, you’ll notice something important. It focuses more on “how” prices move rather than “why” they move. In other words, it does not try to figure out a stock’s real or fair value. Also, it doesn’t worry much about big economic factors. Instead, it looks closely at price actions and trading volume.
So, this method is very helpful for both traders and investors. It helps them make smarter decisions based on how prices have behaved in the past.
Types of Charts Used in Technical Analysis
Introduction to Candlestick Charts
Candlestick charts are a popular choice among traders in technical analysis. This is because they offer a clear and easy way to see how prices move. So, instead of looking at just numbers, traders can use these charts to quickly spot what’s happening in the market.
As you study candlestick patterns, you will see different shapes and setups—such as doji, hammers, and shooting stars. Each one tells a story. For example, a doji often shows that the market is unsure about which way to go. On the other hand, a hammer may suggest that the market could soon reverse direction.
Candlestick patterns are useful because they show market psychology and emotions on one chart. In other words, they help you understand what buyers and sellers might be thinking. And most importantly, they do this in a way that is easy to read and understand.
So, the power of candlestick charts lies in how they take complex market actions and turn them into simple visual signals.
Line Charts and Their Significance
Line charts are a basic but powerful tool in chart analysis. They work by connecting closing prices over a chosen period of time. And because they are simple, they make it easy to see the overall direction of a stock’s price. So, their main strength is clarity.
Line charts remove extra details that can distract traders. As a result, they let you focus on the bigger picture. This helps you better understand where the price is heading over time.
These charts are especially helpful for spotting long-term trends. By linking closing prices in a straight line, they show whether the price is going up, going down, or staying the same. So, at a quick glance, you can tell how an asset is doing over time.
In short, line charts give you a clean and clear view of price movements, which is why so many traders rely on them.
Bar Charts and Their Application
Bar charts are another important tool in a technical analyst’s toolbox. In these charts, price movement is shown using vertical bars. Each bar shows the range between the high and low prices of an asset during a set time period.
So, why are bar charts useful? They are great for showing how much prices move. By looking at the height of each bar, you can quickly see how big or small the price changes are. As a result, they help you understand price volatility.
Also, bar charts are very helpful for spotting key price levels. You can use them to study highs and lows and find important turning points in the market. So, for traders who want to track price action closely, bar charts are a very valuable tool.
Exploring Different Chart Types
The financial world is full of choices, and so are the strategies used by traders and investors. Depending on your own trading goals and style, you can pick from many different chart types to fit your needs. And because each chart type offers something unique, understanding how they differ is very important. So, learning these differences helps you make better choices when looking at financial data.
For example, you might choose candlestick charts if you want detailed price patterns. Or, you may prefer line charts if you like something simple and easy to follow. On the other hand, if you want to study price ups and downs, bar charts can show you market volatility clearly.
So, your choice really depends on your trading method and what kind of market insight you need. By learning how to use different chart types, you can improve your technical analysis skills. And most importantly, you’ll be better prepared to understand and move through the financial markets with confidence.

Key Components of Technical Analysis Charts
Interpretation of Price and Time Scales
When you start looking at charts, one of the first things to learn is how to read the price and time scales on the chart. First, the horizontal line at the bottom shows time. This could be minutes, days, months, or even years, depending on the chart. Then, the vertical line on the side shows price. Here, it is important to know if the scale is linear or logarithmic.
So, by learning how these scales work, you can adjust your analysis to different timeframes. And as a result, you can better understand how the price moves over time. This skill is very important because it helps you choose the right timeframe for your trading style. Also, it allows you to read past data more clearly and make smarter decisions.
Understanding Price Movements
The heart of chart analysis is understanding how price moves show what the market feels and does. Every rise and fall in a price happens because of many buyers and sellers making decisions together. So, by studying price movements, you can learn about the market’s mood and behavior.
For example, when you see an uptrend, it means buyers are stronger and control the market. On the other hand, a downtrend shows that sellers have more power. Therefore, by knowing what affects price moves, you can make better trading choices. This knowledge helps you take the right side in the market, which is very important for success.
Role of Volume in Chart Analysis
Volume, which means the number of shares or contracts traded, is a very important part of chart analysis. It works together with price patterns to give you more information about how strong a market move really is.
For example, when volume goes up along with big price changes, it shows that many people are trading. This means the market is more active and the move is stronger. On the other hand, low volume can mean the market is unsure or that not many traders are interested. So, by looking at volume and price patterns together, you get a clearer picture. This helps you check if a trend or reversal is more likely to be real.
In short, understanding volume is like having extra eyes on the market’s feelings. And because of this, your analysis becomes stronger and more trustworthy.
Technical Indicators for Chart Analysis
Technical indicators are very useful tools in chart analysis. They help you understand possible price moves before they happen. These indicators use math formulas and past data to give you helpful information.
So, traders and investors rely on them to make smarter decisions. In this section, we will introduce some of the most common indicators. And by learning about them, you will get a basic idea of how they help in reading charts.
Moving Averages and Their Uses
Moving averages are basic but important technical indicators. They work by smoothing out price data over a set time period. And because of this, they help you see the trend in the market more clearly.
So, by calculating the average price over time, moving averages give you a simple, visual way to understand which direction an asset is moving.
Also, moving averages help traders cut through short-term price noise. This way, you can focus on the bigger trend. As a result, they become very useful for finding good times to enter or exit trades, based on the moving average’s direction.
Therefore, learning how to use moving averages well can make your chart analysis much stronger and more effective.
Relative Strength Index (RSI)
The Relative Strength Index, or RSI, is a momentum tool that helps you see if an asset is overbought or oversold. It looks at how fast and how much the price changes. Because of this, RSI gives clues about whether the price might reverse or keep going the same way.
So, understanding RSI is very important for traders. When the RSI number is very high, it usually means the asset is overbought. This often suggests the price could fall soon. On the other hand, when the RSI number is very low, it may mean the asset is oversold. This can hint that the price might rise soon.
Therefore, knowing how to read RSI well is a key skill in chart analysis and helps traders make better decisions at the right time.
Stochastic Oscillator and Its Significance
The stochastic oscillator is an important indicator that helps traders find possible trend reversals. It does this by comparing the closing price of an asset to its price range over a set period of time. In other words, it shows where the closing price stands within the recent high and low prices.
This indicator is especially useful for spotting points where the market might change direction. So, by learning how to read the stochastic oscillator, traders can better identify good moments to enter or exit trades. This makes it a valuable part of any trader’s toolkit.
MACD (Moving Average Convergence Divergence)
The Moving Average Convergence Divergence, or MACD, is a flexible technical indicator. It mixes features of both trend-following and momentum tools. The MACD uses two moving averages: the MACD line and the signal line.
Because of this, MACD helps traders understand how strong a trend is and which way it is moving. By watching how these two lines come together or move apart, traders can make better choices about when to enter or exit the market. This makes MACD a very useful tool in trading.
Combining Indicators for Enhanced Analysis
While each technical indicator has its own strengths, using more than one indicator together gives you a fuller view of the market. In fact, this approach makes your analysis more reliable because you check signals from different indicators at the same time.
Also, by combining indicators, traders can better confirm when a trend might change or reverse. This helps reduce the chances of being fooled by false signals. So, this section will show you how to use several indicators together. By doing this, you build a stronger and clearer way to make your trading decisions.

Chart Reading Strategies and Techniques
Using Chart Patterns for technical analysis (Head and Shoulders, Double Tops)
Chart patterns, or pattern recognition, are a basic and important skill in chart analysis. Patterns like triangles, head and shoulders, and double tops are like the market’s way of speaking. So, when you learn to read these patterns, you can often predict what the market might do next.
For example, a head and shoulders pattern usually shows a reversal is coming. Likewise, a double top often signals that prices may turn down. Also, a triangle pattern points to a possible breakout soon. Because of this, pattern recognition is a very important part of reading charts. And by mastering it, you can make much better decisions in the market.
Identifying Trend Lines
Trend lines are like a compass when you analyze charts. They connect important price points, giving you a clear picture of where the market is heading. Also, trend lines work as moving support and resistance levels. Because of this, they help traders find good spots to enter or exit trades.
So, by learning how to use trend lines well, you can make smarter trading choices. In addition, you can follow the market’s momentum and stay on the right side of the trend.
Applying Support and Resistance in Trading
Support and resistance levels are like beacons that guide traders in making smart decisions. First, support is the price level where an asset usually stops falling and often bounces back up. Then, resistance is the price level where the asset usually stops rising and may start to fall.
Because of this, using these levels well is very important for picking good entry and exit points. Also, they act like safety nets that help protect your money and reduce losses. So, learning how to use support and resistance levels in your trading plan can greatly help you manage risk better.
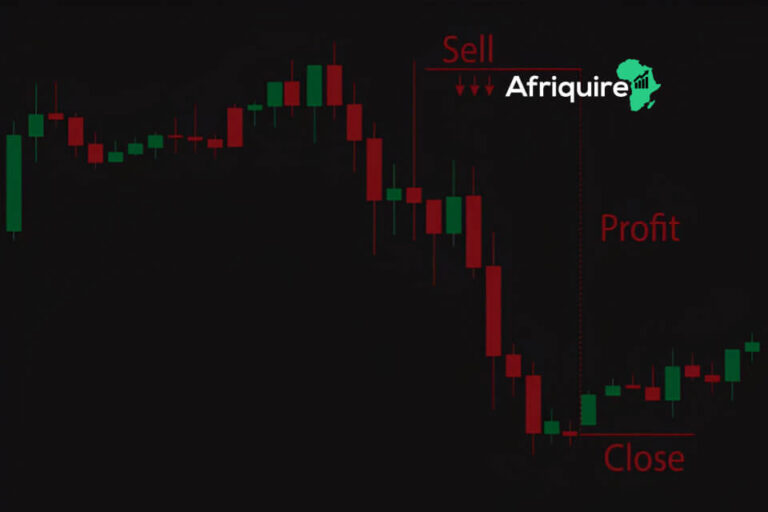
Entry and Exit Points in Chart Reading
Timing is very important in trading, and knowing when to enter and exit trades is a big part of reading charts in technical analysis. By looking at charts, you can find the best moments to buy or sell assets.
Also, good entry and exit points often come from using different techniques together. For example, pattern recognition, trend line analysis, and support and resistance all help. So, by learning and mastering these methods, you can improve how precisely you make your trades.
Risk Management Strategies
Protecting your capital is the most important rule in trading. No matter how good you are at reading charts, there is always some risk involved.
Because of this, risk management is very important. For example, setting stop-loss orders, spreading your investments across different assets, and never putting in more money than you can afford to lose are key steps. By using these strategies, you can reduce losses and keep your money safe. This way, you make sure you can keep trading for many days to come.
Mistakes to Avoid in Chart Reading
Mistakes in chart reading can be costly. Let’s discuss some common errors to steer clear of:
Example 1: Ignoring Fundamental Analysis
One mistake traders make is solely relying on technical analysis and disregarding fundamental analysis. Suppose you’re examining a stock chart, and it appears to be in a strong uptrend. However, you haven’t considered recent negative news about the company’s financials.
By neglecting fundamental analysis, you might enter a long position, unaware that the stock is fundamentally weak. This mistake emphasizes the importance of balancing technical and fundamental analysis for a well-rounded view.
Example 2: Overlooking Divergence
Divergence is a valuable concept in technical analysis. It occurs when the price and a technical indicator move in opposite directions. For instance, while the price is making higher highs, the Relative Strength Index (RSI) is making lower highs.
If you overlook divergence, you may miss potential reversal signals. By being aware of divergence, you can avoid entering or holding positions that are at risk of a sudden trend reversal.

Frequently Asked Questions (FAQs)
1. What is technical analysis?
Technical analysis is a method of evaluating securities based on historical price and volume data to predict future trends.
2. Why is chart reading important in technical analysis?
Chart reading helps identify patterns, trends, and potential price movements, providing valuable insights for investment decisions.
3. How do I choose the right chart type for analysis?
The choice of chart type depends on your trading strategy. Different types offer different insights, so consider your goals.
4. What are support and resistance levels, and how do I use them?
Support levels are price points where an asset tends to stop falling, while resistance levels are where it tends to stop rising. They are crucial for setting entry and exit points.
5. How can I effectively manage risk in chart reading and trading?
Risk management involves setting stop-loss orders, diversifying your portfolio, and never investing more than you can afford to lose.
Conclusion
In conclusion, mastering the art of chart reading in technical analysis is a journey well worth embarking upon for traders and investors. By understanding the foundations of technical analysis and familiarizing oneself with various chart types, key components, and essential technical indicators, one can gain a substantial advantage in the financial markets. Moreover, the ability to recognize chart patterns for technical analysis, utilize trend lines, leverage support and resistance, and employ effective risk management strategies equips individuals with the tools needed to make informed decisions.